I don’t think America is bad. I think America contributED to this problem more than other nations TO THIS POINT, and should be held accountable.This is 100% a socialist post...America bad, the rest of the world good, we need a new world order or we are doomed...I guess the Justice League needs to save us.
Let's pivot to China for a second, they have the 2nd largest economy in the world, are you saying that the US needs to give them money to help them with their energy needs?


Colleges
- American Athletic
- Atlantic Coast
- Big 12
- Big East
- Big Ten
- Colonial
- Conference USA
- Independents (FBS)
- Junior College
- Mountain West
- Northeast
- Pac-12
- Patriot League
- Pioneer League
- Southeastern
- Sun Belt
- Army
- Charlotte
- East Carolina
- Florida Atlantic
- Memphis
- Navy
- North Texas
- Rice
- South Florida
- Temple
- Tulane
- Tulsa
- UAB
- UTSA
- Boston College
- California
- Clemson
- Duke
- Florida State
- Georgia Tech
- Louisville
- Miami (FL)
- North Carolina
- North Carolina State
- Pittsburgh
- Southern Methodist
- Stanford
- Syracuse
- Virginia
- Virginia Tech
- Wake Forest
- Arizona
- Arizona State
- Baylor
- Brigham Young
- Cincinnati
- Colorado
- Houston
- Iowa State
- Kansas
- Kansas State
- Oklahoma State
- TCU
- Texas Tech
- UCF
- Utah
- West Virginia
- Illinois
- Indiana
- Iowa
- Maryland
- Michigan
- Michigan State
- Minnesota
- Nebraska
- Northwestern
- Ohio State
- Oregon
- Penn State
- Purdue
- Rutgers
- UCLA
- USC
- Washington
- Wisconsin
High School
- Illinois HS Sports
- Indiana HS Sports
- Iowa HS Sports
- Kansas HS Sports
- Michigan HS Sports
- Minnesota HS Sports
- Missouri HS Sports
- Nebraska HS Sports
- Oklahoma HS Sports
- Texas HS Hoops
- Texas HS Sports
- Wisconsin HS Sports
- Cincinnati HS Sports
- Delaware
- Maryland HS Sports
- New Jersey HS Hoops
- New Jersey HS Sports
- NYC HS Hoops
- Ohio HS Sports
- Pennsylvania HS Sports
- Virginia HS Sports
- West Virginia HS Sports
ADVERTISEMENT
Install the app
How to install the app on iOS
Follow along with the video below to see how to install our site as a web app on your home screen.
Note: This feature may not be available in some browsers.
You are using an out of date browser. It may not display this or other websites correctly.
You should upgrade or use an alternative browser.
You should upgrade or use an alternative browser.
Wrong Again: 50 Years of Failed Eco-pocalyptic Predictions
- Thread starter Pospecteer
- Start date
China IS developing, and they are being held accountable.So then why do we have to change our Capitalist system and they're allowed to keep their Socialist systems?
Who is requiring China to send the money it generates to developing nations to help them combat climate change?
Most are not advocating that the US abandon a capitalist system.
Yeah, I think I'm going to put him back on ignore. While some of the stupid stuff he says is amusing, it is futile trying to have a conversation with someone who has the intelligence of a 10-year old.
That is what you always do when you get exposed.
To understand trends? NoThat is just not true...they are trying to become more accurate, but they are not there, and they never will, unless we can use satellites and calculate using yet to be discovered new identifiers. Now lets go back before 40 years...you need that data to prove climate change...are you admitting that that data might be flawed?
It’s like discussing this with a fvcking 6 yr old.
My 6 year old Grand daughter has more patience than you. She doesn't whine or stomp around when she can't get her way nearly as much as YOU do.
I don’t think America is bad. I think America contributED to this problem more than other nations TO THIS POINT, and should be held accountable.
"I don’t think America is bad" is a pretty telling statement. I guess we need to pay reparations to France, Russia, and China...

China IS developing, and they are being held accountable.
Most are not advocating that the US abandon a capitalist system.
You Sir are wrong. China nor any other Socialist system is NOT being asked to abandon their inefficient and wasteful Government nor redistribuite ANY of their incomes.
We are being asked to do both to allow them to keep contributing to "climate change" while we have to give up our automobiles and air conditioners as well as our economic Freedoms.
BS.
"I don’t think America is bad" is a pretty telling statement. I guess we need to pay reparations to France, Russia, and China...
It is Leftist dogma to blame America for all the problems in the world. It's just what they do.
That is just not true...they are trying to become more accurate, but they are not there, and they never will, unless we can use satellites and calculate using yet to be discovered new identifiers. Now lets go back before 40 years...you need that data to prove climate change...are you admitting that that data might be flawed?
There are three prominent reconstructions of monthly global mean surface temperature (GMST) from instrumental data (fig. 1): NASA's GISTEMP analysis, the CRUTEM analysis (from the University of East Anglia's Climatic Research Unit), and an analysis by NOAA's National Climatic Data Center (NCDC).
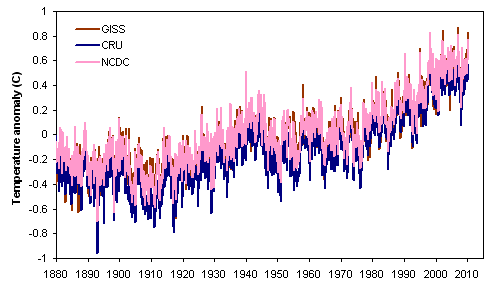
Figure 1. Comparison of global (land & ocean) mean surface temperature reconstructions from NASA GISS, the University of East Anglia's CRU, and NOAA NCDC.
How reliable are these temperature reconstructions? Various questions have been raised about both the data and the methods used to produce them. Now, thanks to the hard work of many people, we can conclude that the three global temperature analyses are reasonable, and the true surface temperature trend is unlikely to be substantially different from the picture drawn by NASA, CRU, and NOAA.
The three GMST analyses have much in common, though there are significant differences among them as well. All three have at their core the monthly temperature data from the Global Historical Climatology Network (GHCN), and all three produce both a land-stations-only reconstruction and a combined land/ocean reconstruction that includes sea surface temperature measurements.
Let's explore the reliability of these reconstructions, from several different angles.
The data and software used to produce these reconstructions are publicly available
Source code and data to recreate GISTEMP and CRUTEM are available from NASA and CRU websites. (The data set provided by CRU excludes a fraction of the data that were obtained from third parties, but the results are not substantially affected by this).
The software has been successfully tested outside of NASA and CRU, and it works as advertised
Both GISTEMP and CRUTEM have been successfully implemented by independent investigators. For example, Ron Broberg has run both the CRUTEM and GISTEMP code. In addition, the Clear Climate Code project has duplicated GISTEMP in Python. Figure 2 shows a comparison of the output of the GISTEMP reconstruction process as implemented by NASA and by Clear Climate Code ... but since the results are identical, the second line falls exactly on top of the first.

Figure 2. The GISTEMP land/ocean temperature analysis as implemented by NASA and by Clear Climate Code. Results of the two analyses are effectively identical.
Similar results can be obtained using different software and methods
Over the past year, there has been quite a flurry of "do-it-yourself" temperature reconstructions by independent analysts, using either land-only or combined land-ocean data. In addition to the previously-mentioned work by Ron Broberg and Clear Climate Code, these include the following:
(There are probably others as well that we're omitting!)
Most recently, the Muir Russell investigation in the UK was able to write their own software for global temperature analysis in a couple of days.
For all of these cases, the results are generally quite close to the "official" results from NASA GISS, CRU, and NOAANCDC. Figure 3 shows a collection of seven land-only reconstructions, and Figure 4 shows five global (land-ocean) reconstructions.
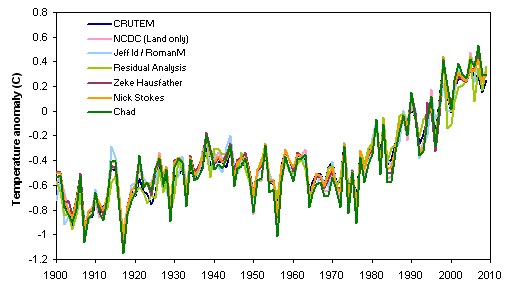
Figure 3. Comparison of land-only reconstructions, 1900-2009. Note that the NASA GISS reconstruction using only land stations is not shown here, because it is conceptually different from the other analyses.
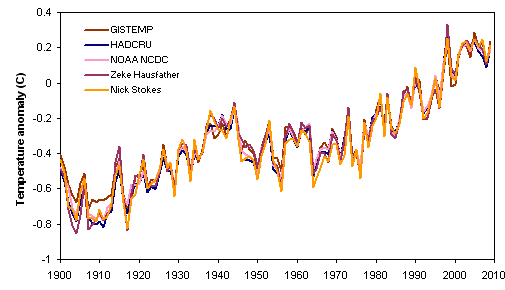
Figure 4. Comparison of land-ocean reconstructions, 1900-2009.
Obviously, the results of the reconstructions are quite similar, whether they're by the "Big Three" or by independent analysts.
The temperature increase is not an artifact of the GHCN adjustment process
Most of the analyses shown above actually use the raw (unadjusted) GHCN data. Zeke Hausfather has done comparisons using both the adjusted and raw versions of the GHCN data set, and as shown in fig. 5, the results are not substantially different at the global scale (though 2008 is a bit of an outlier).
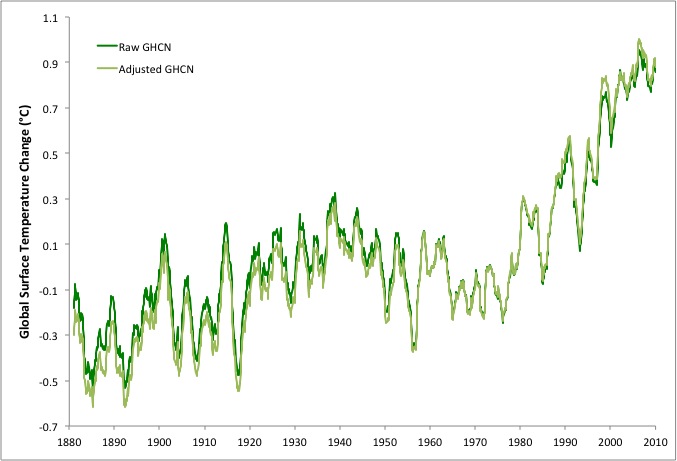
Figure 5. Comparison of global temperatures from raw and adjusted Global Historical Climatology Network (GHCN) v3 data, 1880–2010 (analysis by Zeke Hausfather).
The temperature increase is not an artifact of declining numbers of stations
While it is true that the number of stations in GHCN has decreased since the early 1990s, that has no real effect on the results of spatially weighted global temperature reconstructions. How do we know this?
- Comparisons of trends for stations that dropped out versus stations that persisted post-1990 show no difference in the two populations prior to the dropouts (see, e.g., here and here and here).
- The spatial weighting processes (e.g., gridding) used in these analyses makes them robust to the loss of stations. In fact, Nick Stokes has shown that it's possible to derive a global temperature reconstructionusing just 61 stations worldwide (in this case, all the stations from GISTEMP that are classified as rural, have at least 90 years of data, and have data in 2010).
- Other data sets that don't suffer from GHCN's decline in station numbers show the same temperature increase (see below).
The temperature increase is not an artifact of stations being located at airports
This might seem like an odd statement, but some people have suggested that the tendency for weather stations to be located at airports has artificially inflated the temperature trend. Fortunately, there is not much difference in the temperature trend between airport and non-airport stations.
The temperature increase is present in other data sets, not just GHCN
All of the above studies rely (mostly or entirely) on monthly station data from the GHCN database. But it turns out that other, independent data sets give very similar results.
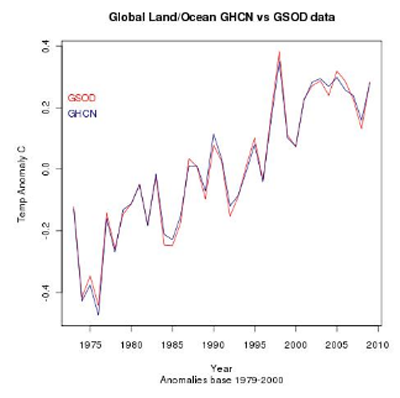
Figure 6. Comparison of global temperatures from the Global Historical Climatology Network (GHCN) and Global Summary of the Day (GSOD) databases. (Analysis by Ron Broberg and Nick Stokes).
What about satellite measurements of temperatures in the lower troposphere? There are two widely cited analyses of temperature trends from the MSU sensor on NOAA's polar orbiting earth observation satellites, one from Remote Sensing Systems (RSS) and one from the University of Alabama-Huntsville (UAH). These data only go back to 1979, but they do provide a good comparison to the surface temperature data over the past three decades. Figure 7 shows a comparison of land, ocean, and global temperature data from the surface reconstructions (averaging the multiple analyses shown in figs. 3 and 4) and from satellites (averaging the results from RSS and UAH):
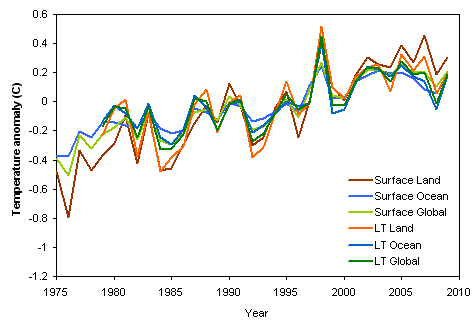
Figure 7. Comparison of temperatures from surface stations and satellite monitoring of the lower troposphere.
Reanalysis data sets also show the same warming trend. A ‘reanalysis’ is a climate or weather model simulation of the past that incorporates data from historical observations. Reanalysis comparisons by Vose et al. (2012) and Compo et al. (2013) find nearly identical global surface warming trends as in the instrumental record (Figure 8).
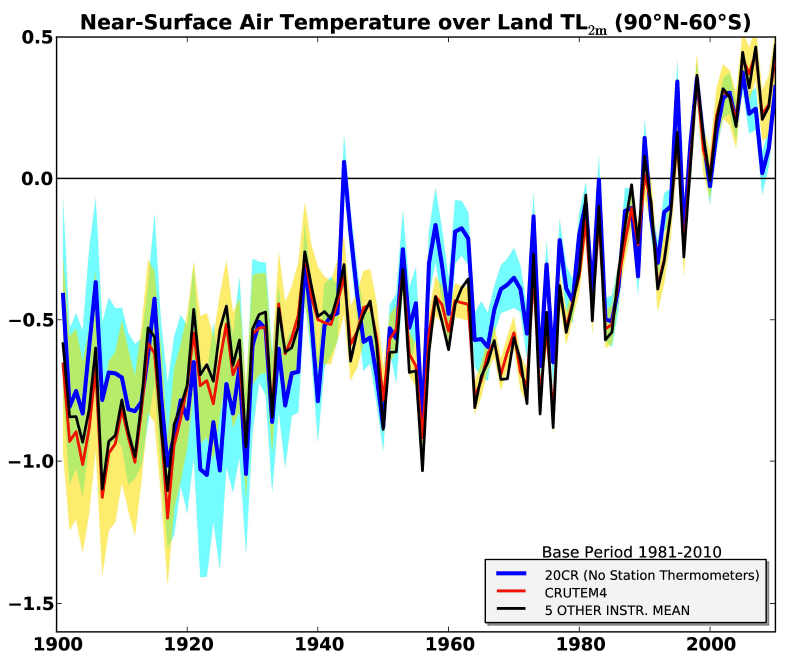
Figure 8. Temporal comparison of near-global land (90°N–60°S) 2 meter air temperature anomalies (TL2m) between 20CR and station-temperature based estimates. Red curve: global TL2m anomaly series from CRUTEM4, black curve: the average of five additional station-temperature datasets, and blue curve: the 20CR. 95% uncertaintyranges are shown for CRUTEM4 (yellow fill) and 20CR (blue fill) and their overlap (green fill). From Compo et al. (2013)
A paper by Anderson et al. (2012) created a new global surface temperature record reconstruction using 173 records with some type of physical or biological link to global surface temperatures (corals, ice cores, speleothems, lake and ocean sediments, and historical documents). The study compared their reconstruction to the instrumental temperature record and found a strong correlation between the two (0.76; Figure 9).
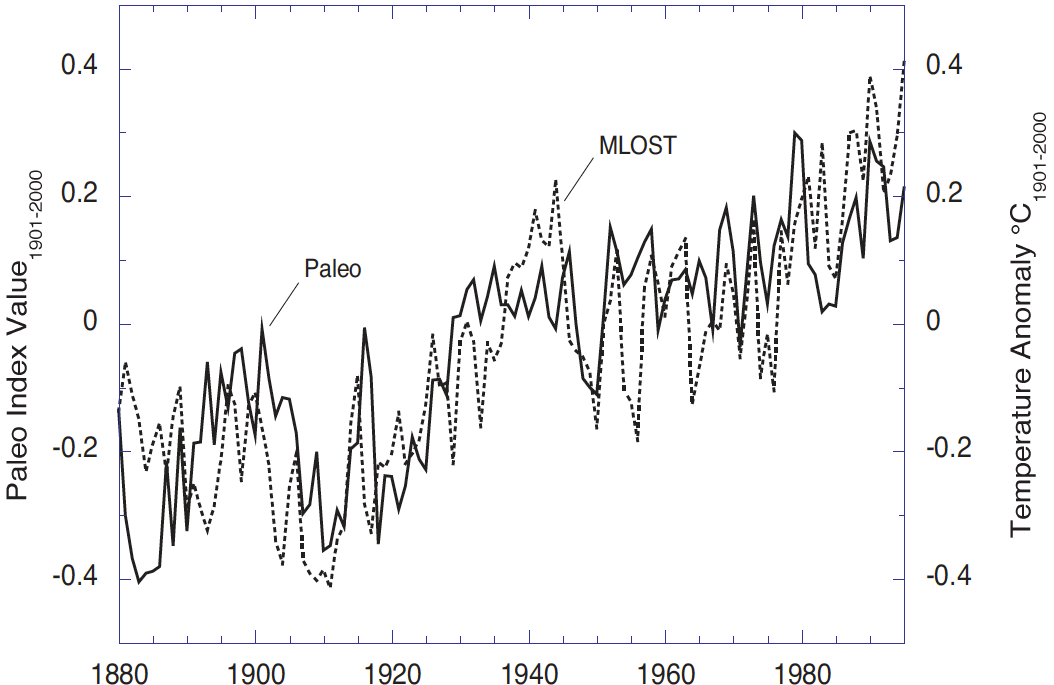
Figure 9. Paleo Index (solid) and the merged land-ocean surface temperature anomalies (MLOST, dashed) relative to 1901-2000. The range of the paleo trends index values is coincidentally nearly the same as the GST although the quantities are different (index values versus temperature anomalies °C).
We'll end by looking at all the surface and satellite-based temperature trends over the entire period for which both are available (1979-present). What are the trends in the various data sets and regions? As shown in fig. 9, the surface temperature trends over land have a fair amount of variability, but all lie between +0.2 and +0.3 C/decade. Surface trends that include the oceans are more uniform.
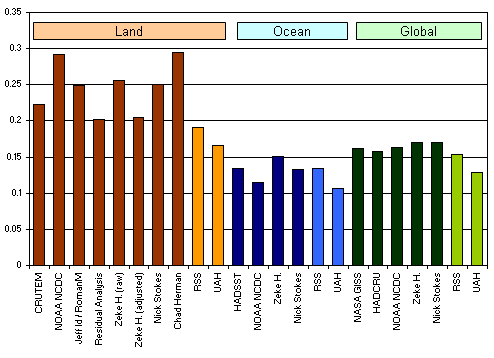
Figure 9. Comparison of temperature trends, in degrees C per decade.
Overall, the satellite measurements show lower trends than surface measurements. This is a bit of a puzzle, because climate models suggest that overall the lower troposphere should be warming about 1.2X faster than the surface (though over land there should be little difference, or the surface should be warming faster). Thus, there are at least three possibilities:
- The surface temperature trends show slightly too much warming.
- The satellite temperature trends show slightly too little warming.
- The prediction of climate models (about amplified warming in the lower troposphere) is incorrect, or there are complicating factors that are being missed.
Conclusions
The well-known and widely-cited reconstructions of global temperature, produced by NASA GISS, UEA CRU, and NOAA NCDC, are replicable.
Independent studies using different software, different methods, and different data sets yield very similar results.
The increase in temperatures since 1975 is a consistent feature of all reconstructions, and is also a feature found in reconstructions from natural temperature proxymeasurements. This increase cannot be explained as an artifact of the adjustment process, or the lack of diligence in collection of the data.
Another post full of crapYou Sir are wrong. China nor any other Socialist system is NOT being asked to abandon their inefficient and wasteful Government nor redistribuite ANY of their incomes.
We are being asked to do both to allow them to keep contributing to "climate change" while we have to give up our automobiles and air conditioners as well as our economic Freedoms.
BS.
To understand trends? No
In order to prove a trend, you need to have strong accurate data, it is actually more important in trending than it is in other scientific endeavors. I am not asking you to change your views (you own them) I am just asking for transparency in the discussion. By adding p values in reporting out future trends seems pretty fair to me, how about you?
There are three prominent reconstructions of monthly global mean surface temperature (GMST) from instrumental data (fig. 1): NASA's GISTEMP analysis, the CRUTEM analysis (from the University of East Anglia's Climatic Research Unit), and an analysis by NOAA's National Climatic Data Center (NCDC).
Figure 1. Comparison of global (land & ocean) mean surface temperature reconstructions from NASA GISS, the University of East Anglia's CRU, and NOAA NCDC.
How reliable are these temperature reconstructions? Various questions have been raised about both the data and the methods used to produce them. Now, thanks to the hard work of many people, we can conclude that the three global temperature analyses are reasonable, and the true surface temperature trend is unlikely to be substantially different from the picture drawn by NASA, CRU, and NOAA.
The three GMST analyses have much in common, though there are significant differences among them as well. All three have at their core the monthly temperature data from the Global Historical Climatology Network (GHCN), and all three produce both a land-stations-only reconstruction and a combined land/ocean reconstruction that includes sea surface temperature measurements.
Let's explore the reliability of these reconstructions, from several different angles.
The data and software used to produce these reconstructions are publicly available
Source code and data to recreate GISTEMP and CRUTEM are available from NASA and CRU websites. (The data set provided by CRU excludes a fraction of the data that were obtained from third parties, but the results are not substantially affected by this).
The software has been successfully tested outside of NASA and CRU, and it works as advertised
Both GISTEMP and CRUTEM have been successfully implemented by independent investigators. For example, Ron Broberg has run both the CRUTEM and GISTEMP code. In addition, the Clear Climate Code project has duplicated GISTEMP in Python. Figure 2 shows a comparison of the output of the GISTEMP reconstruction process as implemented by NASA and by Clear Climate Code ... but since the results are identical, the second line falls exactly on top of the first.
Figure 2. The GISTEMP land/ocean temperature analysis as implemented by NASA and by Clear Climate Code. Results of the two analyses are effectively identical.
Similar results can be obtained using different software and methods
Over the past year, there has been quite a flurry of "do-it-yourself" temperature reconstructions by independent analysts, using either land-only or combined land-ocean data. In addition to the previously-mentioned work by Ron Broberg and Clear Climate Code, these include the following:
(There are probably others as well that we're omitting!)
Most recently, the Muir Russell investigation in the UK was able to write their own software for global temperature analysis in a couple of days.
For all of these cases, the results are generally quite close to the "official" results from NASA GISS, CRU, and NOAANCDC. Figure 3 shows a collection of seven land-only reconstructions, and Figure 4 shows five global (land-ocean) reconstructions.
Figure 3. Comparison of land-only reconstructions, 1900-2009. Note that the NASA GISS reconstruction using only land stations is not shown here, because it is conceptually different from the other analyses.
Figure 4. Comparison of land-ocean reconstructions, 1900-2009.
Obviously, the results of the reconstructions are quite similar, whether they're by the "Big Three" or by independent analysts.
The temperature increase is not an artifact of the GHCN adjustment process
Most of the analyses shown above actually use the raw (unadjusted) GHCN data. Zeke Hausfather has done comparisons using both the adjusted and raw versions of the GHCN data set, and as shown in fig. 5, the results are not substantially different at the global scale (though 2008 is a bit of an outlier).
Figure 5. Comparison of global temperatures from raw and adjusted Global Historical Climatology Network (GHCN) v3 data, 1880–2010 (analysis by Zeke Hausfather).
The temperature increase is not an artifact of declining numbers of stations
While it is true that the number of stations in GHCN has decreased since the early 1990s, that has no real effect on the results of spatially weighted global temperature reconstructions. How do we know this?
- Comparisons of trends for stations that dropped out versus stations that persisted post-1990 show no difference in the two populations prior to the dropouts (see, e.g., here and here and here).
- The spatial weighting processes (e.g., gridding) used in these analyses makes them robust to the loss of stations. In fact, Nick Stokes has shown that it's possible to derive a global temperature reconstructionusing just 61 stations worldwide (in this case, all the stations from GISTEMP that are classified as rural, have at least 90 years of data, and have data in 2010).
One prominent claim (by Joe D'Aleo and Anthony Watts) was that the loss of "cool" stations (at high altitudes, high latitudes, and rural areas) created a warming bias in the temperature trends. But Ron Broberg conclusively disproved this, by comparing trends after removing the categories of stations in question. D'Aleo and Watts are simply wrong.
- Other data sets that don't suffer from GHCN's decline in station numbers show the same temperature increase (see below).
The temperature increase is not an artifact of stations being located at airports
This might seem like an odd statement, but some people have suggested that the tendency for weather stations to be located at airports has artificially inflated the temperature trend. Fortunately, there is not much difference in the temperature trend between airport and non-airport stations.
The temperature increase is present in other data sets, not just GHCN
All of the above studies rely (mostly or entirely) on monthly station data from the GHCN database. But it turns out that other, independent data sets give very similar results.
Figure 6. Comparison of global temperatures from the Global Historical Climatology Network (GHCN) and Global Summary of the Day (GSOD) databases. (Analysis by Ron Broberg and Nick Stokes).
What about satellite measurements of temperatures in the lower troposphere? There are two widely cited analyses of temperature trends from the MSU sensor on NOAA's polar orbiting earth observation satellites, one from Remote Sensing Systems (RSS) and one from the University of Alabama-Huntsville (UAH). These data only go back to 1979, but they do provide a good comparison to the surface temperature data over the past three decades. Figure 7 shows a comparison of land, ocean, and global temperature data from the surface reconstructions (averaging the multiple analyses shown in figs. 3 and 4) and from satellites (averaging the results from RSS and UAH):
Figure 7. Comparison of temperatures from surface stations and satellite monitoring of the lower troposphere.
Reanalysis data sets also show the same warming trend. A ‘reanalysis’ is a climate or weather model simulation of the past that incorporates data from historical observations. Reanalysis comparisons by Vose et al. (2012) and Compo et al. (2013) find nearly identical global surface warming trends as in the instrumental record (Figure 8).
Figure 8. Temporal comparison of near-global land (90°N–60°S) 2 meter air temperature anomalies (TL2m) between 20CR and station-temperature based estimates. Red curve: global TL2m anomaly series from CRUTEM4, black curve: the average of five additional station-temperature datasets, and blue curve: the 20CR. 95% uncertaintyranges are shown for CRUTEM4 (yellow fill) and 20CR (blue fill) and their overlap (green fill). From Compo et al. (2013)
A paper by Anderson et al. (2012) created a new global surface temperature record reconstruction using 173 records with some type of physical or biological link to global surface temperatures (corals, ice cores, speleothems, lake and ocean sediments, and historical documents). The study compared their reconstruction to the instrumental temperature record and found a strong correlation between the two (0.76; Figure 9).
Figure 9. Paleo Index (solid) and the merged land-ocean surface temperature anomalies (MLOST, dashed) relative to 1901-2000. The range of the paleo trends index values is coincidentally nearly the same as the GST although the quantities are different (index values versus temperature anomalies °C).
We'll end by looking at all the surface and satellite-based temperature trends over the entire period for which both are available (1979-present). What are the trends in the various data sets and regions? As shown in fig. 9, the surface temperature trends over land have a fair amount of variability, but all lie between +0.2 and +0.3 C/decade. Surface trends that include the oceans are more uniform.
Figure 9. Comparison of temperature trends, in degrees C per decade.
Overall, the satellite measurements show lower trends than surface measurements. This is a bit of a puzzle, because climate models suggest that overall the lower troposphere should be warming about 1.2X faster than the surface (though over land there should be little difference, or the surface should be warming faster). Thus, there are at least three possibilities:
It should be noted that in the past the discrepancy between surface and satellite temperature trends was much larger. Correcting various errors in the processing of the satellite data has brought them into much closer agreement with the surface data.
- The surface temperature trends show slightly too much warming.
- The satellite temperature trends show slightly too little warming.
- The prediction of climate models (about amplified warming in the lower troposphere) is incorrect, or there are complicating factors that are being missed.
Conclusions
The well-known and widely-cited reconstructions of global temperature, produced by NASA GISS, UEA CRU, and NOAA NCDC, are replicable.
Independent studies using different software, different methods, and different data sets yield very similar results.
The increase in temperatures since 1975 is a consistent feature of all reconstructions, and is also a feature found in reconstructions from natural temperature proxymeasurements. This increase cannot be explained as an artifact of the adjustment process, or the lack of diligence in collection of the data.
What's the source of all of that?
You said that I thought we were bad. I simply stated I didn’t."I don’t think America is bad" is a pretty telling statement. I guess we need to pay reparations to France, Russia, and China...
Fornfuture trends, sure— I’d have no problem with that, as long as the passion for spreading misinformation stops. This is a serious issue. Do I want America to bow and scrape? No. Do I think America should drop to the fetal position and continuously apologize to the world allowing our pockets robbed? No. Do I want my AC? Yes. Do I want my family safe and happy? Yes.In order to prove a trend, you need to have strong accurate data, it is actually more important in trending than it is in other scientific endeavors. I am not asking you to change your views (you own them) I am just asking for transparency in the discussion. By adding p values in reporting out future trends seems pretty fair to me, how about you?
I just want American power focused towards helping the world (this INCLUDES us) deal with this issue. Let’s understand it, let’s find solutions, and let use our might to solve it ASAP.
China IS developing, and they are being held accountable.
Most are not advocating that the US abandon a capitalist system.
The "new green deal" is the biggest march toward Socialism" that we've seen offered in this country since the ACA.
Throughout this thread, you’ll find my posts (mostly) consist of accurate information that I have derived from reading articles (no, not just magazine articles in Forbes) on the subject. I’ve spent more time than I should’ve trying to explain to you basic science that you would’ve been informed of if you had read any literature on the subject NOT FROMA RIGHTWING THINKTANK.You invent them.
You have peppered the thread with misinformation, insults, elementary questions that only retard the discussion, and foolish assumptions and dangerous accusations.
There are three prominent reconstructions of monthly global mean surface temperature (GMST) from instrumental data (fig. 1): NASA's GISTEMP analysis, the CRUTEM analysis (from the University of East Anglia's Climatic Research Unit), and an analysis by NOAA's National Climatic Data Center (NCDC).
Figure 1. Comparison of global (land & ocean) mean surface temperature reconstructions from NASA GISS, the University of East Anglia's CRU, and NOAA NCDC.
How reliable are these temperature reconstructions? Various questions have been raised about both the data and the methods used to produce them. Now, thanks to the hard work of many people, we can conclude that the three global temperature analyses are reasonable, and the true surface temperature trend is unlikely to be substantially different from the picture drawn by NASA, CRU, and NOAA.
The three GMST analyses have much in common, though there are significant differences among them as well. All three have at their core the monthly temperature data from the Global Historical Climatology Network (GHCN), and all three produce both a land-stations-only reconstruction and a combined land/ocean reconstruction that includes sea surface temperature measurements.
Let's explore the reliability of these reconstructions, from several different angles.
The data and software used to produce these reconstructions are publicly available
Source code and data to recreate GISTEMP and CRUTEM are available from NASA and CRU websites. (The data set provided by CRU excludes a fraction of the data that were obtained from third parties, but the results are not substantially affected by this).
The software has been successfully tested outside of NASA and CRU, and it works as advertised
Both GISTEMP and CRUTEM have been successfully implemented by independent investigators. For example, Ron Broberg has run both the CRUTEM and GISTEMP code. In addition, the Clear Climate Code project has duplicated GISTEMP in Python. Figure 2 shows a comparison of the output of the GISTEMP reconstruction process as implemented by NASA and by Clear Climate Code ... but since the results are identical, the second line falls exactly on top of the first.
Figure 2. The GISTEMP land/ocean temperature analysis as implemented by NASA and by Clear Climate Code. Results of the two analyses are effectively identical.
Similar results can be obtained using different software and methods
Over the past year, there has been quite a flurry of "do-it-yourself" temperature reconstructions by independent analysts, using either land-only or combined land-ocean data. In addition to the previously-mentioned work by Ron Broberg and Clear Climate Code, these include the following:
(There are probably others as well that we're omitting!)
Most recently, the Muir Russell investigation in the UK was able to write their own software for global temperature analysis in a couple of days.
For all of these cases, the results are generally quite close to the "official" results from NASA GISS, CRU, and NOAANCDC. Figure 3 shows a collection of seven land-only reconstructions, and Figure 4 shows five global (land-ocean) reconstructions.
Figure 3. Comparison of land-only reconstructions, 1900-2009. Note that the NASA GISS reconstruction using only land stations is not shown here, because it is conceptually different from the other analyses.
Figure 4. Comparison of land-ocean reconstructions, 1900-2009.
Obviously, the results of the reconstructions are quite similar, whether they're by the "Big Three" or by independent analysts.
The temperature increase is not an artifact of the GHCN adjustment process
Most of the analyses shown above actually use the raw (unadjusted) GHCN data. Zeke Hausfather has done comparisons using both the adjusted and raw versions of the GHCN data set, and as shown in fig. 5, the results are not substantially different at the global scale (though 2008 is a bit of an outlier).
Figure 5. Comparison of global temperatures from raw and adjusted Global Historical Climatology Network (GHCN) v3 data, 1880–2010 (analysis by Zeke Hausfather).
The temperature increase is not an artifact of declining numbers of stations
While it is true that the number of stations in GHCN has decreased since the early 1990s, that has no real effect on the results of spatially weighted global temperature reconstructions. How do we know this?
- Comparisons of trends for stations that dropped out versus stations that persisted post-1990 show no difference in the two populations prior to the dropouts (see, e.g., here and here and here).
- The spatial weighting processes (e.g., gridding) used in these analyses makes them robust to the loss of stations. In fact, Nick Stokes has shown that it's possible to derive a global temperature reconstructionusing just 61 stations worldwide (in this case, all the stations from GISTEMP that are classified as rural, have at least 90 years of data, and have data in 2010).
One prominent claim (by Joe D'Aleo and Anthony Watts) was that the loss of "cool" stations (at high altitudes, high latitudes, and rural areas) created a warming bias in the temperature trends. But Ron Broberg conclusively disproved this, by comparing trends after removing the categories of stations in question. D'Aleo and Watts are simply wrong.
- Other data sets that don't suffer from GHCN's decline in station numbers show the same temperature increase (see below).
The temperature increase is not an artifact of stations being located at airports
This might seem like an odd statement, but some people have suggested that the tendency for weather stations to be located at airports has artificially inflated the temperature trend. Fortunately, there is not much difference in the temperature trend between airport and non-airport stations.
The temperature increase is present in other data sets, not just GHCN
All of the above studies rely (mostly or entirely) on monthly station data from the GHCN database. But it turns out that other, independent data sets give very similar results.
Figure 6. Comparison of global temperatures from the Global Historical Climatology Network (GHCN) and Global Summary of the Day (GSOD) databases. (Analysis by Ron Broberg and Nick Stokes).
What about satellite measurements of temperatures in the lower troposphere? There are two widely cited analyses of temperature trends from the MSU sensor on NOAA's polar orbiting earth observation satellites, one from Remote Sensing Systems (RSS) and one from the University of Alabama-Huntsville (UAH). These data only go back to 1979, but they do provide a good comparison to the surface temperature data over the past three decades. Figure 7 shows a comparison of land, ocean, and global temperature data from the surface reconstructions (averaging the multiple analyses shown in figs. 3 and 4) and from satellites (averaging the results from RSS and UAH):
Figure 7. Comparison of temperatures from surface stations and satellite monitoring of the lower troposphere.
Reanalysis data sets also show the same warming trend. A ‘reanalysis’ is a climate or weather model simulation of the past that incorporates data from historical observations. Reanalysis comparisons by Vose et al. (2012) and Compo et al. (2013) find nearly identical global surface warming trends as in the instrumental record (Figure 8).
Figure 8. Temporal comparison of near-global land (90°N–60°S) 2 meter air temperature anomalies (TL2m) between 20CR and station-temperature based estimates. Red curve: global TL2m anomaly series from CRUTEM4, black curve: the average of five additional station-temperature datasets, and blue curve: the 20CR. 95% uncertaintyranges are shown for CRUTEM4 (yellow fill) and 20CR (blue fill) and their overlap (green fill). From Compo et al. (2013)
A paper by Anderson et al. (2012) created a new global surface temperature record reconstruction using 173 records with some type of physical or biological link to global surface temperatures (corals, ice cores, speleothems, lake and ocean sediments, and historical documents). The study compared their reconstruction to the instrumental temperature record and found a strong correlation between the two (0.76; Figure 9).
Figure 9. Paleo Index (solid) and the merged land-ocean surface temperature anomalies (MLOST, dashed) relative to 1901-2000. The range of the paleo trends index values is coincidentally nearly the same as the GST although the quantities are different (index values versus temperature anomalies °C).
We'll end by looking at all the surface and satellite-based temperature trends over the entire period for which both are available (1979-present). What are the trends in the various data sets and regions? As shown in fig. 9, the surface temperature trends over land have a fair amount of variability, but all lie between +0.2 and +0.3 C/decade. Surface trends that include the oceans are more uniform.
Figure 9. Comparison of temperature trends, in degrees C per decade.
Overall, the satellite measurements show lower trends than surface measurements. This is a bit of a puzzle, because climate models suggest that overall the lower troposphere should be warming about 1.2X faster than the surface (though over land there should be little difference, or the surface should be warming faster). Thus, there are at least three possibilities:
It should be noted that in the past the discrepancy between surface and satellite temperature trends was much larger. Correcting various errors in the processing of the satellite data has brought them into much closer agreement with the surface data.
- The surface temperature trends show slightly too much warming.
- The satellite temperature trends show slightly too little warming.
- The prediction of climate models (about amplified warming in the lower troposphere) is incorrect, or there are complicating factors that are being missed.
Conclusions
The well-known and widely-cited reconstructions of global temperature, produced by NASA GISS, UEA CRU, and NOAA NCDC, are replicable.
Independent studies using different software, different methods, and different data sets yield very similar results.
The increase in temperatures since 1975 is a consistent feature of all reconstructions, and is also a feature found in reconstructions from natural temperature proxymeasurements. This increase cannot be explained as an artifact of the adjustment process, or the lack of diligence in collection of the data.
Interesting stuff, it proves that the models come up with similar outcomes using different data points. It does not address the data collection and its accuracy.
That is exactly my point, it's like a bait and switch...when you discuss collection data, you go with comparing models, but no discussion about the actual collection, it is always glossed over. On top of that, they admit that data prior to 1979 is not verifiable but it ends up in studies all the time. The world has changed since 1979, and still no p values are assigned to their conclusions. We are talking a .01 temp. change, how can anyone say that their data could not be off? Admit to the limitations and I am fine with sound, prudent environmental policy moving forward.
And I think the military industrial complex was the biggest march towards socialism since public education and social security.The "new green deal is the biggest March toward Socialism" that we've seen offered in this country since the ACA.
Some programs (and solutions) labeled as “marches toward socialism” work, some don’t. The market and freedom of enterprise will always be a bedrock of American society. This is a Democracy, sometimes programs you don’t agree with are going to be put into action.
There will always be limitations, I absolutely admit. But the trend is obvious.Interesting stuff, it proves that the models come up with similar outcomes using different data points. It does not address the data collection and its accuracy.
That is exactly my point, it's like a bait and switch...when you discuss collection data, you go with comparing models, but no discussion about the actual collection, it is always glossed over. On top of that, they admit that data prior to 1979 is not verifiable but it ends up in studies all the time. The world has changed since 1979, and still no p values are assigned to their conclusions. We are talking a .01 temp. change, how can anyone say that their data could not be off? Admit to the limitations and I am fine with sound, prudent environmental policy moving forward.
Throughout this thread, you’ll find my posts (mostly) consist of accurate information that I have derived from reading articles (no, not just magazine articles in Forbes) on the subject. I’ve spent more time than I should’ve trying to explain to you basic science that you would’ve been informed of if you had read any literature on the subject NOT FROMA RIGHTWING THINKTANK.
You have peppered the thread with misinformation, insults, elementary questions that only retard the discussion, and foolish assumptions and dangerous accusations.
Your pompous assumptions in providing only information that fits your point of view and eliminating all other possibilities while insisting that only you have expertise on a subject no one agrees on is proof of how arrogant and full of yourself you are.
At best it can be argued there is rigorous debate over man-made climate change at worst your assumptions that only your analysis of the data is appropriate is the height of humanistic self assurance.
Last edited:
You said that I thought we were bad. I simply stated I didn’t.
Ok, America is not bad, just not better than China, Russia or NK...got it.
And I think the military industrial complex was the biggest march towards socialism since public education and social security.
Some programs (and solutions) labeled as “marches toward socialism” work, some don’t. The market and freedom of enterprise will always be a bedrock of American society. This is a Democracy, sometimes programs you don’t agree with are going to be put into action.
Well I will agree with you on this point and that is why we vote. When there is honest disagreement, the competition for ideas decides who gets to implement the best policies. That is the essence of a democracy and representative Republic.
There will always be limitations, I absolutely admit. But the trend is obvious.
What's the p value in the trend, and does it fall within the margin of error? Pretty simple request.
You have no facts, no legitimate information, no historical data, no imperial data, no legitimate studies, no common sense to back up your foolish assertions.Your pompous assumptions in providing only information that fits your point of view and eliminating all other possibilities while insisting that only you have expertise on a subject no one agrees on is proof of how arrogant and full of yourself you are.
At best it can be argued there is rigorous debate over man-made climate change at worst your assumptions that only the prescriptions you consider appropriate are the only solutions to the problem is the height of humanistic folly.
At least Prospect came at me with legitimate statistical analytical concerns, you’re preaching about God and the sun like a fool in the street. F off!
Throughout this thread, you’ll find my posts (mostly) consist of accurate information that I have derived from reading articles (no, not just magazine articles in Forbes) on the subject. I’ve spent more time than I should’ve trying to explain to you basic science that you would’ve been informed of if you had read any literature on the subject NOT FROMA RIGHTWING THINKTANK.
You have peppered the thread with misinformation, insults, elementary questions that only retard the discussion, and foolish assumptions and dangerous accusations.
I don't cast aspersions on your opinions I ask for clarifications and seek accurate information.
You try to come off as superior in intellect to anyone else and you get violently angry when someone challenges your assumptions. That's not dialogue that's pejorative insolence and setting yourself up as the authority over everyone else with no one else's ability to challenge whatever your positions are.
There's nothing wrong with a reasonable disagreement over policy but your characterizations of other's disagreements are always placed beneath you and as someone lacking intellect or the resources to challenge your suppositions.
You are supremely arrogant acting as if the debate has been settled and that comes across with virtually everything you post on this subject.
You have no facts, no legitimate information, no historical data, no imperial data, no legitimate studies, no common sense to back up your foolish assertions.
At least Prospect came at me with legitimate statistical analytical concerns, you’re preaching about God and the sun like a fool in the street. F off!
See what I mean like a little child that can't have his way? Follow your own advice.
Lol, this ya'lls go to stance when ya got nothing to back up your bullshit,See what I mean like a little child that can't have his way? Follow your own advice.
Better at what? Everything? JFCOk, America is not bad, just not better than China, Russia or NK...got it.
Lol, this ya'lls go to stance when ya got nothing to back up your bullshit,
Try Mime Keyser. It makes more sense than anything else you say.
Last edited:
Pffft.....weak, just like most of your arguments. Full of craziness and delusion.See what I mean like a little child that can't have his way? Follow your own advice.
You are the arrogant one, never reading any information on a subject then acting like you’re informed enough to discuss it.I don't cast aspersions on your opinions I ask for clarifications and seek accurate information.
You try to come off as superior in intellect to anyone else and you get violently angry when someone challenges your assumptions. That's not dialogue that's pejorative insolence and setting yourself up as the authority over everyone else with no one else's ability to challenge whatever your positions are.
There's nothing wrong with a reasonable disagreement over policy but your characterizations of other's disagreements are always placed beneath you and as someone lacking intellect or the resources to challenge your suppositions.
You are supremely arrogant acting as if the debate has been settled and that comes across with virtually everything you post on this subject.
The market and freedom of enterprise will always be a bedrock of American society
Where is there a market demand for the elimination of gasoline powered automobiles airplanes and fossil fuel?
Where is market-driven freedom of choice involved in government run & mandated Healthcare with no access to private individual health insurance?
Your platitudes are belied by the current Democrat Socialist agenda.
Last edited:
You are the arrogant one, never reading any information on a subject then acting like you’re informed enough to discuss it.
I want you to explain why you get to determine whose dissent is not worthy of consideration and lacking of intellect?
Pffft.....weak, just like most of your arguments. Full of craziness and delusion.
You're still here? I told you to follow your own advice!
You are the arrogant one, never reading any information on a subject then acting like you’re informed enough to discuss it.
I asked you a simple question that doesn't require a lot of graphs, charts, formulas, and studies to prove you know the answer.
Do human beings have more control over heating and/or cooling of the planet and therefore "changing" of its climate than the Sun and earth's rotational axis around it?
It's a simple Yes or a simple No. The fact you refuse to answer that proves everything else you try to claim about human control over planetary "climate change" is bogus.
When it’s based on intellect that doesn’t have comprehension of 6th grade science, or even just the most basic facts about the process being discussed, I make the determination.I want you to explain why you get to determine whose dissent is not worthy of consideration and lacking of intellect?
When it’s based on intellect that doesn’t have comprehension of 6th grade science, or even just the most basic facts about the process being discussed, I make the determination.
Fine. Your opinions are certainly valid yet also commensurate with ass holes. Everyone has one and most of 'em stink.
Similar threads
- Replies
- 0
- Views
- 138
- Replies
- 0
- Views
- 203
- Replies
- 0
- Views
- 106
ADVERTISEMENT
ADVERTISEMENT